Planning Your Next Snail Campaign Using Data, Not Guesswork
Stop repeating last season's mistakes. Learn how to use production data from previous snail campaigns to plan smarter, cut costs, and improve yields in heliciculture.
Last spring you stocked 40,000 snails. You used the same feed, the same bays, the same team. Yet the harvest came in 20% below the previous year. Was it the heatwave in week three? A bad feed batch? Or did you simply stock too densely?
If you are planning your next campaign from memory and intuition, you are not really planning, you are hoping.
The Problem: Why Guesswork Fails in Heliciculture
Heliciculture is a high-variability, low-margin business. Small mistakes in stocking density, feed timing, or humidity compound quietly over three to six months, and by the time the symptoms show, the losses are already locked in.
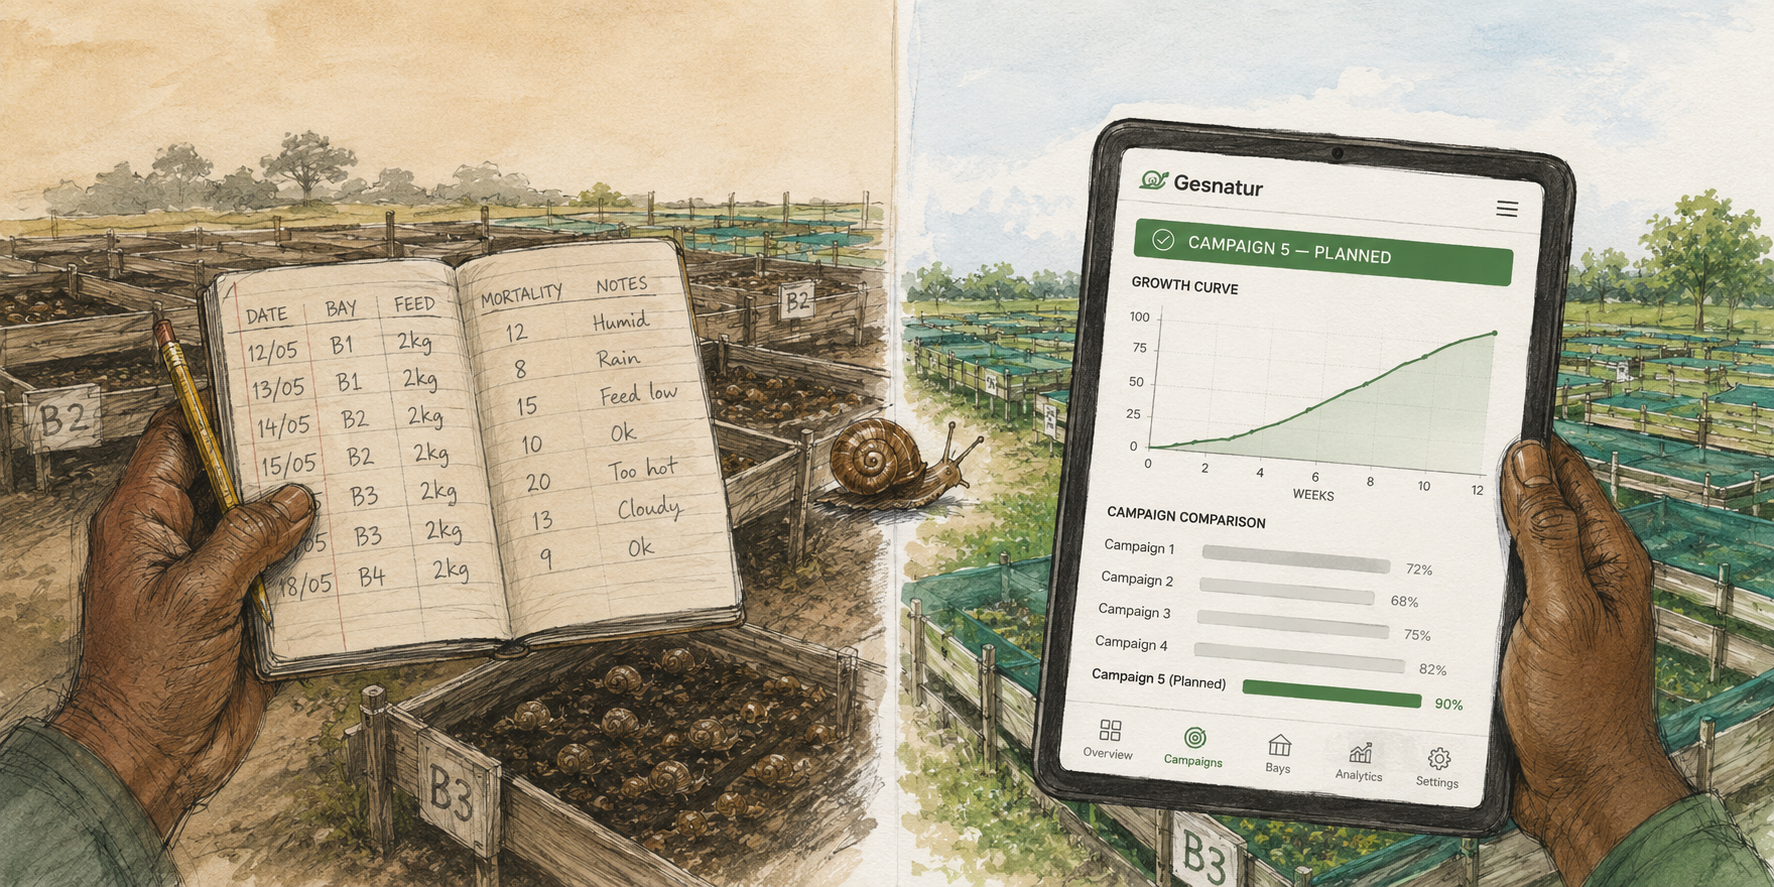
Human memory is selective. You remember the strong harvest, not the three-week mortality spike after a sudden cold snap. Paper notes tell you what happened in one campaign, but they do not tell you whether Campaign 3 outperformed Campaign 1, or why. External factors such as weather, feed quality, or supplier changes only help if you tracked them consistently.
Experience is valuable, but experience without data is just repetition.
The Data You Actually Need
| Data point | Why it matters for planning |
|---|---|
| Mortality curve by week | Pinpoints when snails are most vulnerable so you can time interventions. |
| FCR (Feed Conversion Ratio) | Shows whether your feed strategy is profitable and helps you choose rations and suppliers. |
| Stock depletion rate | Prevents overstocking or understocking the next bay. |
| Cost per kilogram produced | The ultimate profitability metric. If it rose last time, you need to know why. |
| Campaign length versus yield | Some species and conditions need longer cycles; data reveals the best harvest window. |
| Weather correlation | Rain, heat, and humidity logs against mortality and growth help you choose seasonal timing. |
From "I Think" to "I Know"
The gap between a struggling farm and a scaling farm is rarely luck. It is the ability to look at Campaign 4 and say: "In March mortality jumped 12%. Humidity dropped. Next time we install misting before week two."
That kind of insight does not come from a notebook. It comes from structured, comparable data.
How Gesnatur Turns Past Data Into Future Plans
Campaign management. Every campaign is stored as a complete record, not just harvest weights, but daily activities, costs, stock movements, and team inputs. When you plan Campaign 5, Campaigns 1 through 4 become your reference library.
Deep insights and growth models. Our analytics calculate FCR, mortality trends, and financial ROI automatically. Predictions are powered by species-specific growth models built from research literature, so your next campaign starts with science rather than hunches.
Historical comparisons. Compare spring density against autumn density side by side, and see which yielded more per square metre. Allocate your bays with confidence.
Field notebook. Daily records of feeding, maintenance, and weather become searchable data. That "strange week in April" is now a data point you can filter and analyse.
Stop hoping for a better harvest. Start planning for one.